Telemetry · Geospatial · 2026
ADS-B Aircraft Tracker: From RF Hardware to Real-Time Detection
Every aircraft in the sky is constantly announcing itself: where it is, how high it is, and who it is. It does this over a radio system called ADS-B, broadcast on a frequency of 1090 MHz. You would normally see this through a website like FlightRadar24, but those services buy their data from networks of receivers and run it in the cloud. I wanted to know how much of that picture I could build entirely on my own, from hardware I owned, without paying for a feed or relying on anyone else's servers. So I started at the most basic level: pulling those 1090 MHz signals out of the air with my own antenna, decoding them on a Raspberry Pi, and saving every aircraft I detected into a database I could question later.
Tom Shanks
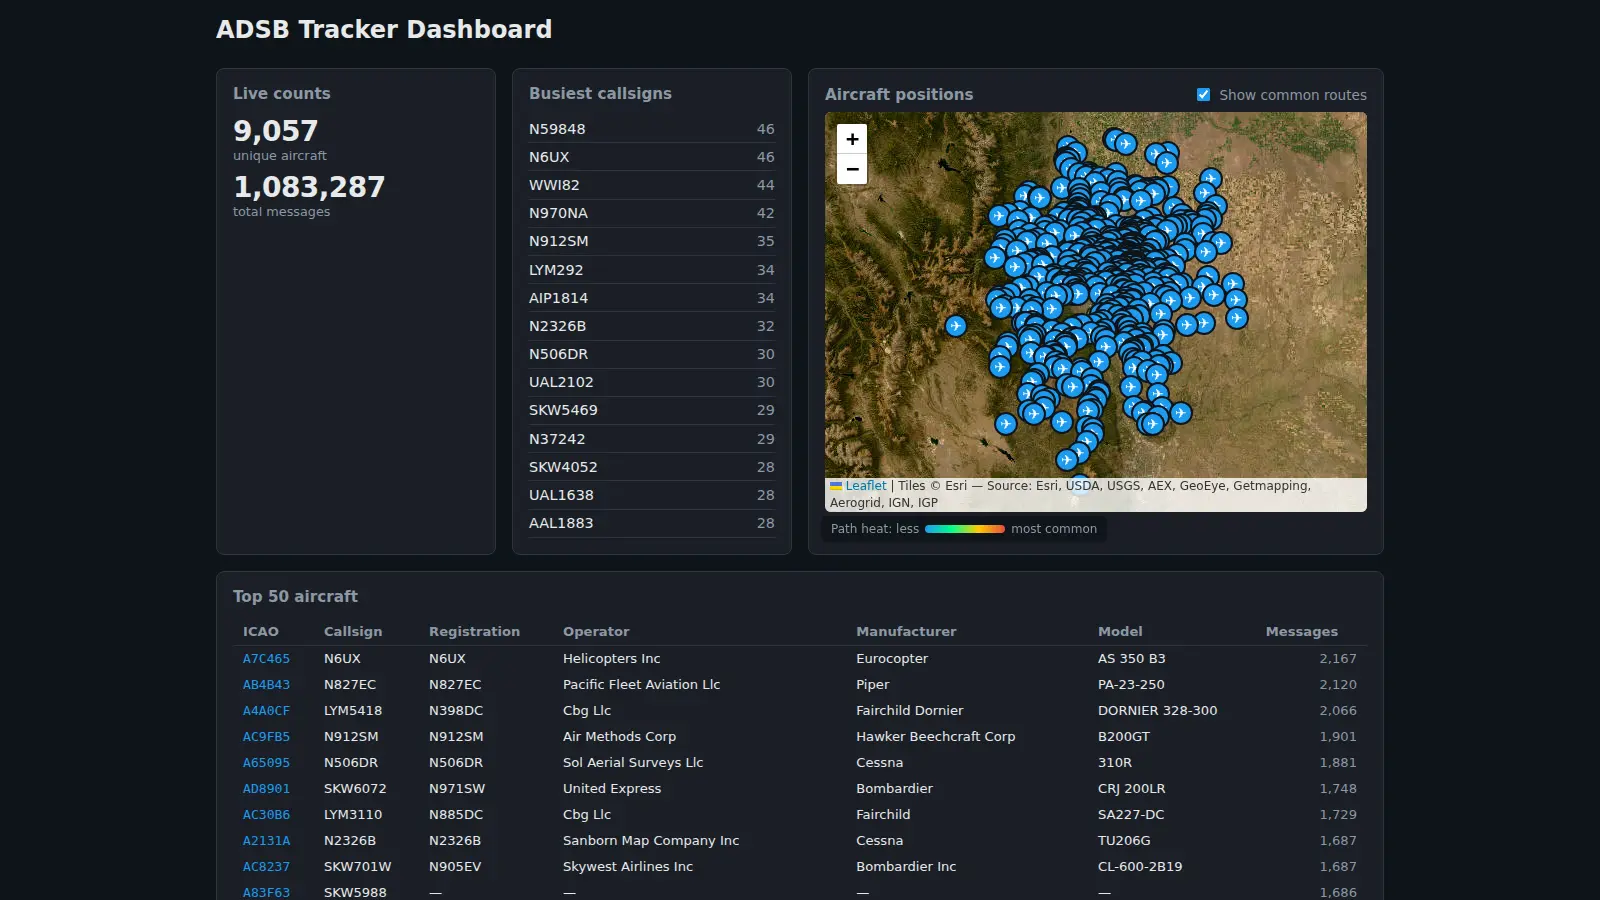
- Messages ingested
- 1.08M
- Aircraft enriched
- 520K
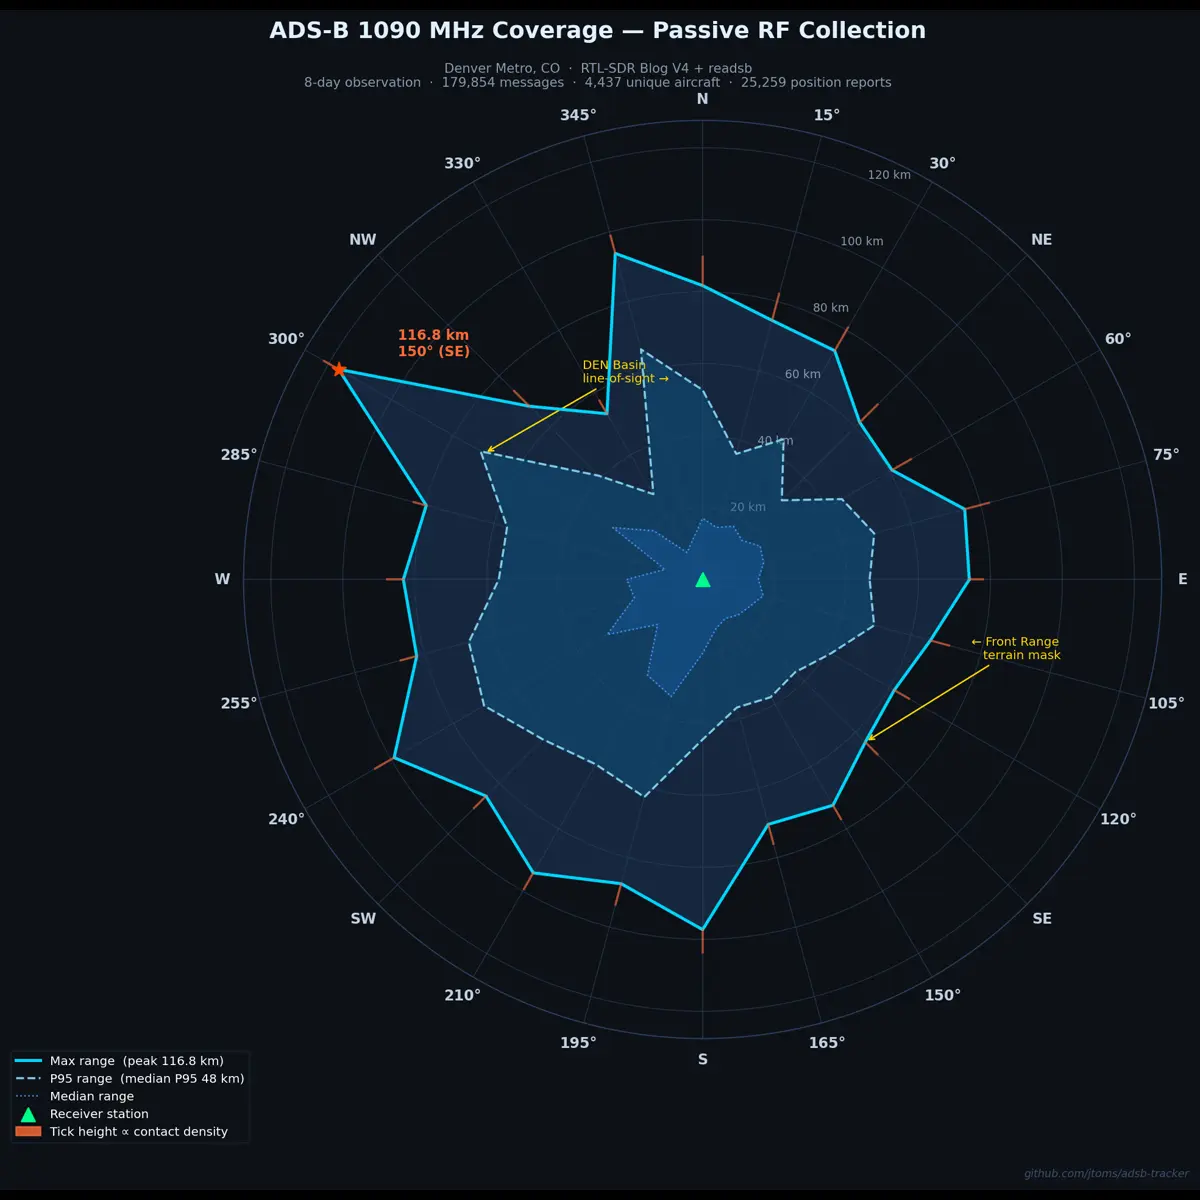
- Receive range
- ~200 km
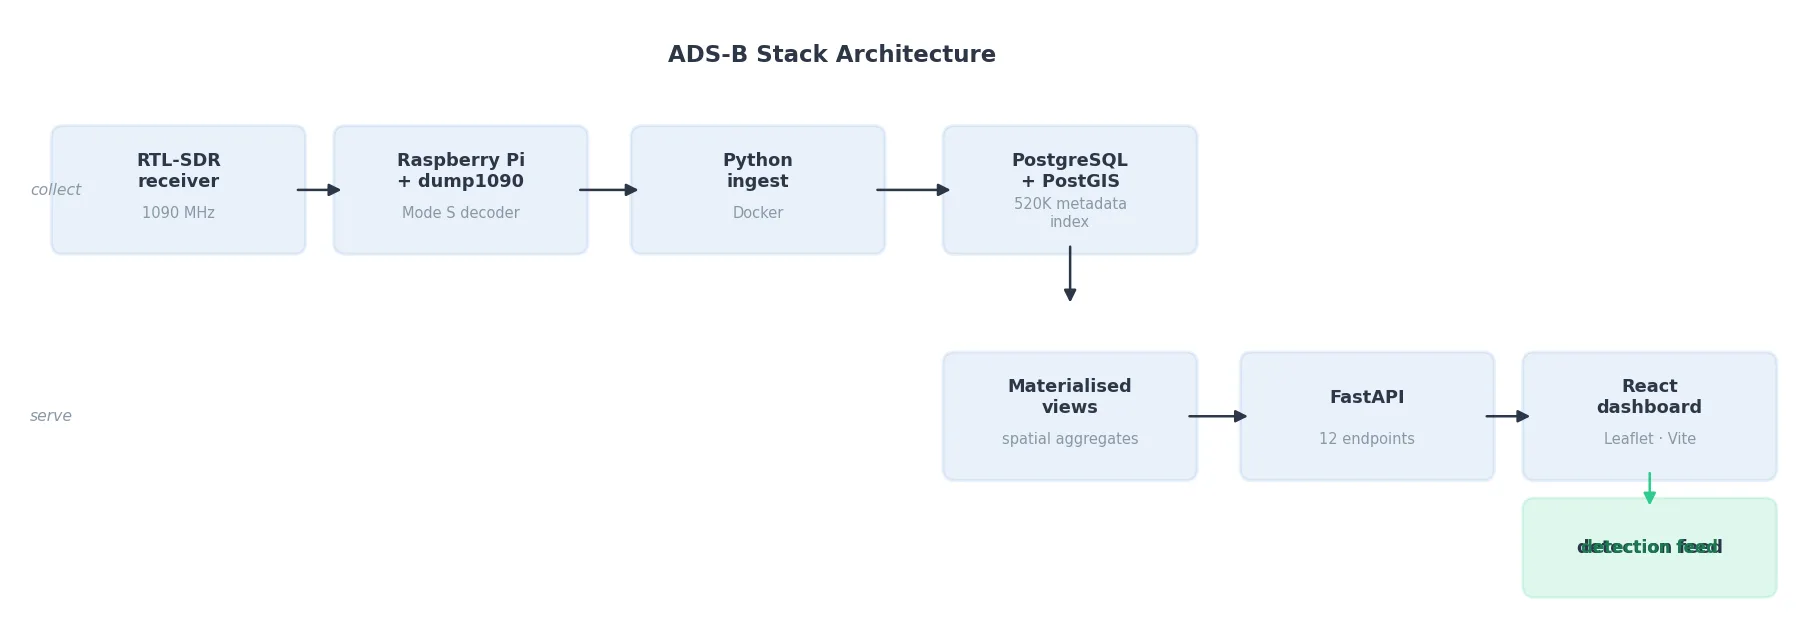
System Architecture
The whole system is a chain of parts, and the easiest way to understand it is to follow a single radio signal from the sky to the screen. To catch the signal I used an RTL-SDR, a cheap USB radio stick that was originally made for watching TV and can be retuned to listen on 1090 MHz. I plugged it into a Raspberry Pi, a small low-power computer, so the receiving station could run quietly around the clock. A raw radio signal on its own is meaningless, so I ran a program called dump1090 that decodes it into readable aircraft messages. Then I wrote a small Python service, packaged in a Docker container so it is easy to start and restart, that takes each decoded message and files it into a database.
I did not pick that database at random. I chose PostgreSQL with its PostGIS extension because PostGIS understands geography. An ordinary database can store a latitude and longitude as two plain numbers, but PostGIS treats them as real locations, so it can answer questions like which aircraft passed within five kilometers of a point, or which compass directions my receiver hears best. A live map of moving dots was never really the goal for me. I wanted to ask questions over time, like which aircraft keep coming back day after day, and those only make sense as spatial queries. I also loaded a reference table of about 520,000 aircraft, because the identifiers a plane broadcasts (a short hex code and a callsign) say almost nothing on their own. Matching them against that table turns a bare code into the operator, the registration, and the aircraft type, and that context changes what a track actually means to me.
There was still a speed problem to solve. Every message lands in one enormous raw table, and re-running the same heavy geographic query against millions of rows every time the page loads would be painfully slow. So I used materialized views, which are saved, pre-computed answers to a query that the database refreshes on a schedule. The questions I ask most often, such as where traffic concentrates, which directions my receiver covers best, and which contacts behave differently from ordinary commercial routes, all read from these views, so the dashboard stays fast.
On top of the database I built an API with FastAPI, a Python framework, exposing twelve endpoints that hand out things like statistics, positions, routes, and receiver range. The dashboard itself is a React app that draws the map and charts with a mapping library called Leaflet.js. The whole stack runs together with Docker Compose inside a Linux environment (WSL2 Ubuntu), managed by the operating system so it starts on its own and keeps running without me.
Rule-Based Flight Pattern Detection
Plotting every aircraft as a dot on a map is the easy part, but it does not tell you which of those contacts is worth a second look. I wanted the system to do that filtering for me, so I built a rule-based detector that watches the live traffic and flags anything that stands out.
The detector runs on a simple cycle. Every two minutes a Python service reads the latest messages and checks each aircraft against a set of rules, and anything that matches is pushed to a detection feed on the dashboard. The rules only look at things I can measure directly: altitude, time of day, callsign patterns, registry information, and how a track moves across the map. I deliberately left machine learning and imagery out of it, because I wanted every flag to have a plain reason behind it that I could explain and check by hand.
Rules in production:
- low_altitude_mil_ops : military-registered airframes below typical commercial altitudes in civil airspace
- night_operations : sustained flight outside daylight hours
- loitering_aircraft : circling within a bounded radius over a sustained interval
- law_enforcement_callsigns : match against curated public-domain LE callsign prefixes
- military_rotary_wing : ICAO hex codes registered to military operators
- mystery_military_aircraft : military-block hex codes with no callsign and no public registry resolution
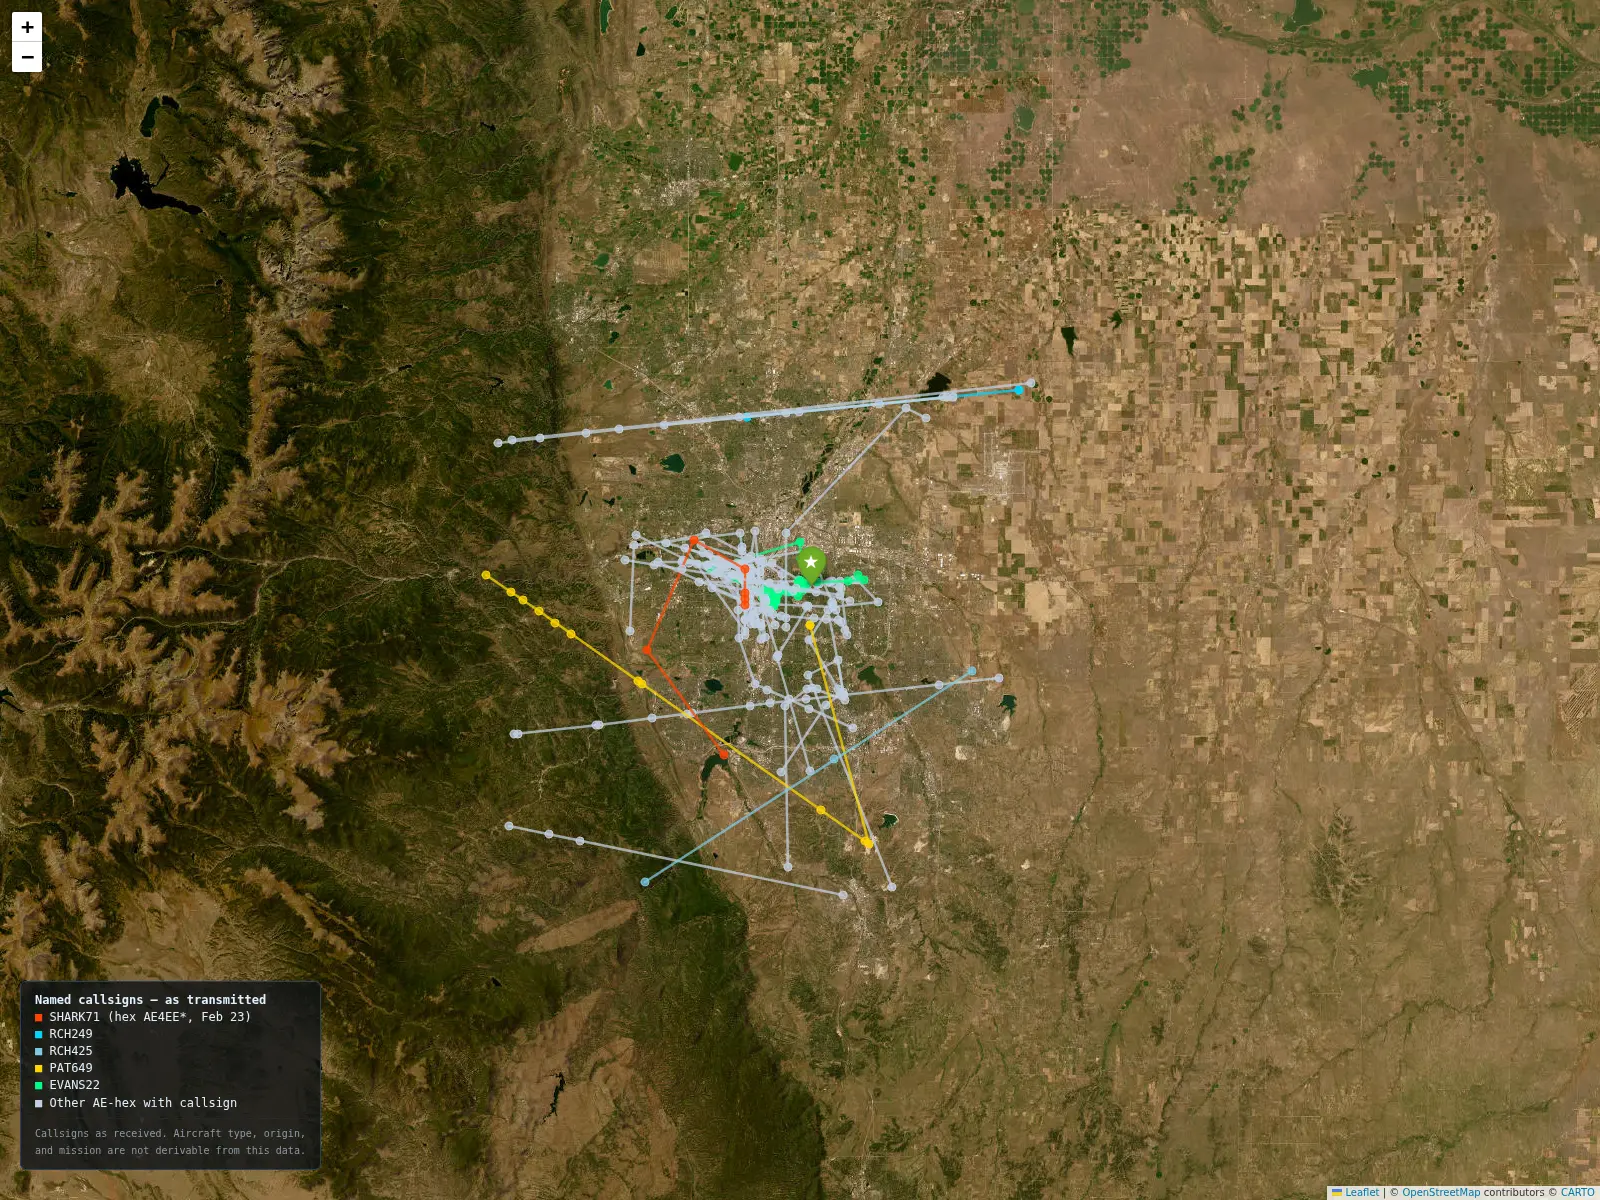
Case Study: Rotary-Wing Cluster, Denver Metro
One evening the detector lit up. Three rules fired at the same time across several aircraft in the same area: military_rotary_wing, night_operations, and low_altitude_mil_ops (1,000–3,000 ft above ground level). I looked the broadcast hex codes up in public aircraft registries, and they came back as Army aviation airframes. The way the aircraft were flying, low and repeatedly over the same urban corridors with another contact holding higher up, matched the public examples I had read about of low-altitude survey or surveillance work. I want to be careful about what that means: it does not prove the mission. What I can say is that the system caught unusual rotary-wing activity on its own and put it in front of me to review.
A third aircraft in the same airspace was stranger still. It broadcast only its position with no callsign attached, it flew back and forth at a constant altitude in a pattern that matched no normal commercial route, and its hex code traced to a military block with no matching entry in any public registry. That is worth flagging, but it is not enough to guess what it was doing. I cannot honestly say more than this: the aircraft was broadcasting its position without enough public information attached to identify it.
The point of the example is not the aircraft itself. It is that the system surfaced the pattern on its own, from radio signals I picked up locally and public reference data, and then left the actual interpretation to me.
Tech Stack
Hardware
RTL-SDR USB receiver (1090 MHz) · Raspberry Pi (decoder host)
Decoding & ingest
dump1090 (Mode S / ADS-B decoder) · Python ingest service
Data
PostgreSQL + PostGIS · 520K-row aircraft metadata index · materialized views
API
FastAPI (Python) · 12 endpoints (stats, positions, routes, receiver range, corridor density, hourly traffic, aircraft detail, detection pipeline)
Frontend
React + Vite · Leaflet.js
Detection
Custom Python pipeline (Docker) · rule-based detection engine, two-minute cadence
Deployment
Docker Compose · WSL2 Ubuntu · systemd user services · local network access only
Status & Access
The whole thing runs as a small production system that stays on around the clock. I keep the dashboard reachable only from devices on my own local network, and the ingest pipeline never sends data anywhere outside it. Contacts and detections keep building up locally, 1,083,226 position messages as of the last count.
Source available on request.